Core Features
Worksheets
Worksheets are designed to build complex forecasts or key metrics using spreadsheet-like formulas. You can use Worksheets to feed forecasts into your PnL or Balance Sheet, or build reports to display key company metrics.
Bring in Actuals
There are two ways to bring in historical data, or Actuals, to your Worksheets: integration through Snowflake, or manual entry.
Sync Actuals with Snowflake
First, make sure you have connected your Snowflake Integration.
After connecting Snowflake, click on the worksheet row you want to pull in Actuals for. Navigate to the Data tab of the sidebar. Select Snowflake from the Integration dropdown, followed by selecting the Data Source, i.e. a column from your Snowflake table.
Here, let's create a simple recurring revenue breakdown that displays:
- Revenue, Beginning of Month
- New (Revenue)
- Reactivation
- Upgrade
- Contraction
- Churn
- Revenue, End of Month

Close the sidebar, and you'll see the Actuals being pulled in for the month-end Revenue.

Repeat the process for the rest of the Actuals to display your Revenue Breakdown:

Manual
Another method of entering Actuals is to enter them manually.
Build Forecasts
Your projected future data is called a Forecast. The forecasted months will be empty until you add your first forecast.
Cloudberry has three ways of adding a forecast into Worksheets:
- Formula Builder
- Spreadsheet formulas
- Pull in values from elsewhere in the financial model, such as the Hiring Plan or another Worksheet
Formula Builder (sidebar)
The automated formula builder is the quickest way to build and maintain simple forecasts in Cloudberry.
To start, click on the row you want to forecast. In this example, we're going to use New Revenue. Switch “Formula Type” from Custom to Automatic, and select the type of formula you want to forecast. The options are
- Average
- Median
- Percentage (%) of another row
Here, let's select Average

Once you close the sidebar, you will see the newly added 3-month average, which applies until the end of the forecast period.

Now, simply forecasting New Revenue as a 3-month average may not provide you with an accurate forecast. A more effective method would be to use your marketing pipeline or sales funnel to feed the new customer count, and then multiply this count by an estimated average revenue per new customer.
Spreadsheet formulas
If you need more customization than the simple sidebar options, you can create your own formula. Cloudberry supports many of the common spreadsheet formulas, such as SUM, AVERAGE, MEDIAN, PERCENTILE, MIN, MAX, and others.
For example, let's create the same AVERAGE we created in the previous step. Start by selecting a row you want to forecast, and click on the first forecasted cell. Here, April:

Next, build your first formula. In this example, we will create a “3-month average” formula. Type
=AVERAGE([
Parentheses work the same as in any spreadsheet formula (to group a formula together), whereas the square bracket instructs Cloudberry which row and time period you want to reference in your formula.

As we're building a forecast that's an average of itself, start by adding:
=AVERAGE([self,

Continue by adding a time period, such as the past three months of Actuals.
=AVERAGE([self, -3a:-1a
The -3 refers to three months ago, whereas -1 is one month ago. The colon in the middle indicates a range, just like it does for spreadsheets. Finally, the "a" indicates we want to lock the formula to Actuals. In other words, this is not a rolling average, but an average of the last three months of your historical data. Once you update your Actuals, the formula will automatically start referencing the most recent three months of Actuals.

Close the bracket, then close the parentheses, and hit enter. The finished formula is
=AVERAGE([self, -3a:-1a])

The result of the formula is 96,020 for the first forecasted month.

Next, drag the formula forward until the end of the forecast period to apply it everywhere.

You can also use a keyboard shortcut to apply the formula to other Forecast months.
First, copy the formula or value you want to apply to the rest of the row.
CTRL/CMD + C
Next, select the entire row you want to forecast.
CTRL/CMD + SHIFT + Right Arrow Key
followed by
CTRL/CMD + V
for pasting the values. You should see the 96,020 per month applied until the end of your forecast period.

Reference Another Worksheet
Another way to create forecasts is to pull in values from another Worksheet.
Let’s say you created a forecast for your New Customers using a separate Worksheet called Marketing Funnel. You could pull this into the current Worksheet by typing:
=[new_customers]
In this formula, new_customers refers to the specific row on the Marketing Funnel Worksheet.
Here's what it would look like:

Update Actuals
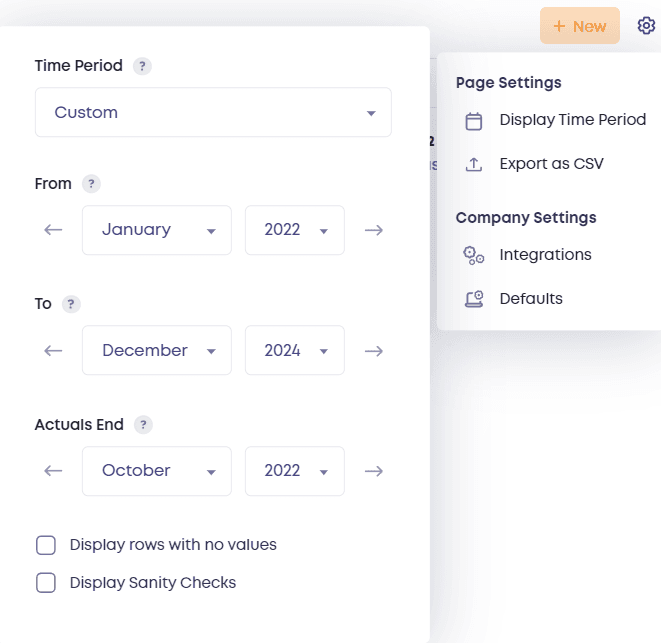
Open up Page Settings, and move the Actuals End dropdown forward (usually by one month). Be careful with this change: there is no way to recover your forecast if you want to revert your Actuals End month change.

Next, navigate to the Settings / Integrations page and click Sync on Snowflake integration. This updates all of your Snowflake data in all Worksheets.

Navigate back to the Worksheets page to see the latest data.

